The Market Diversification Tool Indicators
Breaking Down the Market Diversification Tool Indicators and Calculations
After you enter your selections and click “Go to Results,” the Market Diversification Tool compiles all relevant trade, tariff, and other data related to the products and markets you’ve selected.
Data Sources
The tool uses foreign market-reported international trade data, rather than U.S. trade data, because it calculates import shares (the share of the market’s imports that come from the United States). For example, it would use France’s reported imports from the United States rather than U.S.-reported exports to France. Therefore, the tool depends on markets making their trade and tariff data available to the United Nations and the World Trade Organization (WTO).
Data Requirements
Any markets that do not have enough trade data available from the United Nations Comtrade database (at least three years of data of the five in the period) are not included in the calculations. Furthermore, any market that does not provide its most-favored-nation tariff schedule to the WTO is not included in the calculations.
A market will also be excluded from the calculations if it does not import the product at all.
The tool also pulls in the market-level data (i.e. logistics performance, distance, language). If a market is missing some of the required market-level data, it won’t be included in the calculations.
The “Data Availability Table” in the tool results section shows what data is available for each market and whether there is sufficient data for the market to be included in the results.
Indicator Overview
The Market Diversification Tool uses nine key indicators to calculate the final score and rank potential export markets.
Product-Specific Indicators
Three indicators focus on product-specific data at the Harmonized System (HS) 6-digit level.
- Average Imports from the United States
- Potential Trade
- Maximum Average Tariff
These product-specific indicators help answer the following questions:
- How much of this product has the country historically imported from the United States?
- Is the potential market primed for more exports of this product from the United States?
- What tariffs might an exporter face in this market for this product, and how do they compare to the tariffs the exporter is currently paying?
Country-Level Indicators
The remaining six indicators assess whether a potential market is generally favorable for exporting and doing business.
- Logistics Performance Index
- Regulatory Quality Score
- Language Match
- Distance
- Landlocked Status
- Free Trade Agreement (FTA) with the United States
The country-level indicators help address questions such as:
- Can I depend on the country’s logistics infrastructure?
- How supportive is the regulatory environment?
- Is there a shared language?

Average Imports from the United States
This indicator looks at whether the country is already a significant importer of the product from the U.S. as historic trade is a good predictor of future trade. It is measured as the market’s average imports of the product from the United States over the period. Typically, this is a five-year average if the country has sufficient data available. At a minimum, it is a three-year average. It is shown as the “Average Imports from the U.S.” in the results.
If you select more than one product, the trade data for those products is added up by market—the products are treated as a group for this indicator and potential trade.
All trade data in the tool comes from the United Nations Comtrade Database, the United Nations Commodity Trade Statistics Database, Department of Economic and Social Affairs/Statistics. As noted above, the tool uses foreign market-reported international trade data, rather than U.S. trade data. Markets report their trade data to the UN, which then publishes the trade data in the Comtrade database. ITA obtains UN data under a restricted license that excludes certain public releases.
The Harmonized System, the international system that determines how traded products are classified for tariff assessment and trade data collection, undergoes periodic revisions (typically every five years) to account for new technologies or changes in trade patterns. These are called nomenclature changes. The current nomenclature is the HS 2022 edition. However, countries often report data in older nomenclatures and the time period used in the tool often straddles two nomenclature periods.
ITA staff clean the data and convert it to the correct HS nomenclature where needed. This is to make sure trade data is comparable across countries and across the five-year period currently used in the tool. For this reason, data used in the tool may differ from the data reported in the Comtrade database.
Learn more about the Harmonized System from the World Customs Organization.
Potential Trade
The potential trade indicator projects the potential change in U.S. exports to the market. It combines data on three growth factors into a dollar value of potential additional exports the U.S. could have. It looks at:
- Share Gap: How much U.S. exports could change if U.S. exports perform as well in the market as they do in a region of similar markets?
- Import Growth: How much U.S. exports could change if the country’s import growth or decline patterns continue; and
- Economic Growth: How much U.S. exports might change if the country’s GDP pattern of growth or decline continues.
The Potential Trade Growth indicator uses the market’s average imports of the product from the United States as the base from which to calculate the potential dollar value growth. Therefore, if average imports are low, high percentage point growth in the components of the potential trade indicator may not translate into a high potential trade indicator value. If average imports from the United States are high, even low percentage point growth could lead to a high potential trade indicator value.
In the results, you’ll see these components, which are further described below:
- Average Imports from the World
- Average Imports from the U.S.
- Average U.S. Share of Imports
- Share Gap
- GDP Growth CAGR
- Import growth CAGR
Share Gap
To compare U.S. performance in a market with a region of similar markets, we look at the import share. This is the share of the market or region’s imports of the selected products that are coming from the United States. It’s calculated as the imports from the U.S. divided by the imports from the world. If the U.S. has a lower import share in the market than in the region, then there’s what we call a “Share Gap.” The share gap is the percentage point difference between the country and regional U.S. import shares.
The import share gap shows whether U.S. exports are performing better or worse in the country than in the larger region. Let’s say 20% of the country’s imports of a product come from the United States, but in the region, 30% of the imports of that product are from the U.S. Then the U.S. is “underperforming” in that country, and the share gap would be 30% - 20% = 10%.
Conversely, if 20% of the country’s imports of a product come from the United States, but in the region, only 15% of the imports are from the U.S., then the U.S. is “overperforming” in that country (15% - 20% = -5%). In this case, where the share gap would otherwise be negative, the figure is converted to zero instead.
We might infer that if there is an import share gap, then U.S. exporters could be expected to have a higher share of the import market. A positive share gap indicates that U.S. export performance for the product in that market could be improved. The percentage point share gap value is converted into a dollar value representing the potential increase in U.S. exports of the product to the market if the share gap is eliminated.
Import Growth
This component of the potential trade indicator looks at how the market’s imports from the world have changed over the period. If the imports have been growing, we may expect that growth to continue. Import growth is measured as a compound annual growth rate or CAGR. A CAGR is a constant growth rate that, when applied to the starting value, will achieve the ending value when repeated for each period in the timeframe. It can also be thought of as an average growth rate.
For the algorithm, we use a combination of a CAGR between the first and last years of the period and an alternative CAGR calculated between the average imports and the imports in the last year of the period. The two growth rates are averaged together. This is to give additional weight to the more recent data.
In cases where the full five-year CAGR would be undefined or unable to be calculated, such as when the earliest available year has no recorded imports, the tool only uses the alternative CAGR. The combination of import CAGRs is used to calculate a dollar value of potential increased U.S. exports of the selected products to the market if the import growth or decline trends continue. The five-year annual growth rate (CAGR) is what is displayed in the results.
Economic Growth
The third factor in calculating the potential trade indicator is how much the market’s economy has been growing. If the country has been experiencing economic growth, we can expect the market’s imports to grow as well. This measurement used is the market’s Gross Domestic Product, or GDP, growth. GDP is a measure of the value of a country’s total economic activity in a year. The GDP growth rate is calculated as a compound annual growth rate (CAGR) over the period, just like the import growth.
The data used as the base for the economic growth calculation is the market’s GDP in current U.S. dollars over five years. Data is from the World Development Indicators, The World Bank, GDP (current US$) (NY.GDP.MKTP.CD).
Data for Taiwan come from the National Statistics Republic of China (Taiwan) Directorate General of Budget, Accounting and Statistics Statistical Database.
Maximum Average Tariff
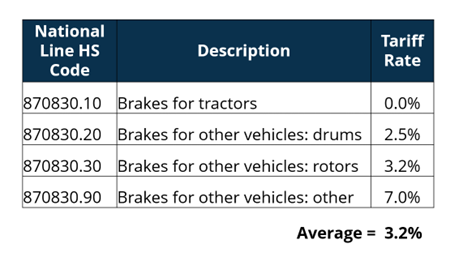
If you are already an exporter, two of the indicators compare the potential markets to the places where you are already exporting. One is the Maximum Average Tariff. Tariff data in the tool is only provided as an average tariff across an entire six-digit subheading, not at the more detailed national line level. Since most countries have more than one tariff line per six-digit subheading, we calculate a simple average tariff rate across the national lines in the six-digit subheading.
So, for the subheading 870830 below, where there are four national tariff lines in the country we are looking at (with tariffs ranging from 0 percent to 7 percent), the average tariff for that six-digit subheading would be 3.2 percent.
If more than one product is selected, then the indicator used is the maximum among the average tariffs for those HS subheadings. This is why the indicator is called the Maximum Average Tariff.
For countries where the United States has a free trade agreement with the market, the tool uses the tariff rates negotiated under the trade agreement. These are called preferential rates. View the final schedules for each FTA.
For countries where the United States does not have a Free Trade Agreement, the tool uses the tariff schedules the market provides to the World Trade Organization for its most-favored-nation tariffs. These are the tariffs the market applies to imports from other members of the World Trade Organization. Most-favored nation tariffs come from the tariff schedules provided by members of the World Trade Organization, Tariff Analysis Online facility.
The tariff data has been modified from its original format for inclusion in the tool. In the case of tariff schedules provided to the WTO in the current Harmonized System nomenclature, simple averages at the six-digit subheading have been calculated. In the case of tariff schedules provided to the WTO in older nomenclatures, the tariff data was averaged first and then converted into the most recent nomenclature. Tariff commitments under FTAs have also been converted to the most recent Harmonized System nomenclature.
Where countries used specific or compound tariffs (i.e. €0.20 per kilogram or 6% + $2 per pair), rather than ad valorem tariffs, every effort was made to accurately calculate ad valorem equivalents (percentage equivalents) for the specific or compound tariffs so that they could be averaged with other tariff lines.
The tool contains average tariff data based on what the country has reported to the WTO or what is in the official schedules of a free trade agreement. It does not contain tariff data related to quotas, anti-dumping or countervailing duties, retaliatory tariffs, or any seasonal tariffs. It is also possible that tariff rates have changed since the data in the tool was incorporated. It is recommended that all users identify the national line tariffs they will face in their markets of interest.
Note: Some tariffs will display very high rates within the tool, up to 999,999 percent. Tariffs of more than 1,000 percent typically indicate that one or more products in that subheading are banned from import in the country. High tariff rates can also occur when there is a specific tariff (i.e. a tariff that is not recorded as a percentage of value) that has been converted into an ad valorem equivalent.
We recommend that all users look for the exact tariff they will face using the CustomsInfo Database. The International Trade Administration provides exporters who use Export.gov with free Access to the CustomsInfo Database, which provides detailed, national line, tariff information for most countries.
The tool compares the maximum average tariff in the markets you are considering to the maximum tariff among the markets where you currently export and calculates the tariff score relative to the markets to which you currently export. This means that if you are already exporting to a market with higher tariffs, other markets with similar tariffs won’t be as penalized for their high tariffs.
The calculations compare tariffs using the square of the difference between the maximum average tariff in the current export market (or 0 for a new exporter) and the maximum average tariff in the market being considered. This method exaggerates the gap between low tariffs and higher tariffs, assigning markets with higher tariffs significantly lower tariff scores than markets with zero or very low tariffs.
Logistics Performance
From the World Bank, the Logistics Performance Index (LPI) uses a survey of operators on the ground working in trade. They provide feedback on the logistics friendliness of each country where they operate and trade. The 2023 LPI ranks 139 countries on six aspects of trade that are important factors when exporting to a country.
- Customs – How efficient is the country’s customs system?
- Infrastructure – What is the quality of the infrastructure used for trade and transportation?
- International Shipments – Can competitively-priced shipments be arranged easily?
- Logistics Competence - How good are logistics services, including trucking, freight forwarding, and customs brokering?
- Tracking & Tracing - How well can shipments be tracked within the country?
- Timeliness - Do shipments reach their destinations within expected times?
Scores for these six factors are compiled into an overall score, which is used in the tool calculations. The score can range from 1 to 5, with a higher score being better. Data for the individual components, which also have scores ranging from 1 to 5, are available on the Data for a “Single Market” page.
For more information and detailed statistics on how countries performed on each of the factors above, see the Logistics Performance Index.
Regulatory Quality Score
Regulatory Quality is an indicator from the World Bank and is calculated with data from a variety of reputable sources. The score can range from -2.5 to 2.5. This indicator tries to capture the perceptions of how well the government is able to develop and implement policies and regulations that promote the development of the private sector in the market. It looks at things like the regulatory burden, tariff and non-tariff barriers to trade, how hard it is to start a business, the level of financial freedom, and unfair competitive practices.
The Regulatory Quality indicator is from the Worldwide Governance Indicators, The World Bank, Regulatory Quality: Estimate.
Language Match
This is the second of the two indicators that compare the potential markets to the places where you are already exporting. This indicator is “yes” for a country if the official language of the country is English or if it shares an official language with one or more of the countries you are already exporting to. The implication is that it is easier to export to a country that has as its official language a language your company is accustomed to. For new exporters, the indicator is set to “yes” only for countries where English is an official language.
Data for official languages comes from The World Factbook. Washington, DC: Central Intelligence Agency.
Distance
Countries that are physically closer tend to trade more with each other. This indicator is a bilateral U.S. distance measurement between the United States and the country. It is from the think tank CEPII’s GeoDist data series, which takes the distance between the most populous city in each country and the most important city in the United States. Distance is given as a number in kilometers. It is a commonly used distance indicator in economic models.
GeoDist Database, Centre d’Etudes Prospectives et d’Informations Internationales (CEPII). The indicator is from the Bilateral US file, “dist” indicator.
Landlocked Status
Being landlocked and not having a seaport makes trade more difficult. Countries that are landlocked are dependent on the use of ports in neighboring countries and transport connections with those markets. This can cause shipping delays due to poor infrastructure and customs and other border procedures. Furthermore, shipping by land is typically more expensive than shipping by sea. Each country is marked “yes” for landlocked or “no” for not landlocked, with being landlocked having a negative impact on the market’s score.
FTA with the United States
Countries with a free trade agreement (FTA) with the United States are marked with a “Yes.” Having an FTA provides additional benefits, beyond lower tariffs, that make it easier to trade with a market. They can reduce non-tariff barriers to trade, make the exporting process quicker, and reduce other transaction costs.
How The Calculations Work
The tool uses normalization to allow it to compare indicators that vary greatly in scale. For example, trade data could be in millions of dollars, while the Logistics Performance Index score will have a maximum value of 5. Sometimes, a higher indicator value is better, such as with the potential trade indicator. Other times, a lower value is better, such as with distance.
The tool normalizes the data for each indicator, which just means converting it to a range between 0 and 1 for the countries you have selected to see in the results. The market with the best score for an indicator gets a normalized score of one, and the country with the worst score gets a zero. The rest of the markets get scores in between relative to the best and worst scores.

Normalizing allows the tool to incorporate indicators with vastly different scales and make that scale the same for each indicator so they can be compared.
The indicators don’t contribute equally to the market’s final score. Each indicator is assigned a specific weight in the algorithm. When you choose whether you are a new or current exporter, a set of pre-calibrated standard weights is entered.
You can use the standard weights we’ve calculated for either new or current exporters or adjust the weights to fit your needs. We recommend you only adjust the weights if you feel comfortable with the various indicators and understand the implications.
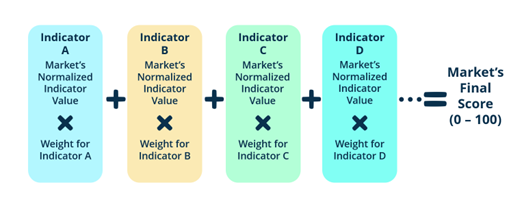
You can change the weights on the “Change Weights” page. The weights must add up to 100 percent. Once the data for each indicator is normalized, the market’s normalized value for the indicator is multiplied by the given weight for that indicator.
The values for each indicator are then added up to provide a final market score. The market score is between 0 and 100, 100 being the best.